

From log to furniture part: how much wood actually arrives?
Purchasers of hardwood components often ask why a part costs several times the price of the same volume of logs. Most of the answer is not margin but loss. Every step between the forest and a finished chair leg removes wood: the saw kerf, the slabs and edgings, drying shrinkage, planing, and above all the defects that have to be cut out before a part is clear enough to use.
This article follows one cubic metre of hardwood log through those steps, using the best open data we could find. Most of it is international or American, because detailed European rough-mill studies for beech and oak are rare, and we say each time which species and which grading system a number describes.
Step 1: the sawmill, from log to lumber
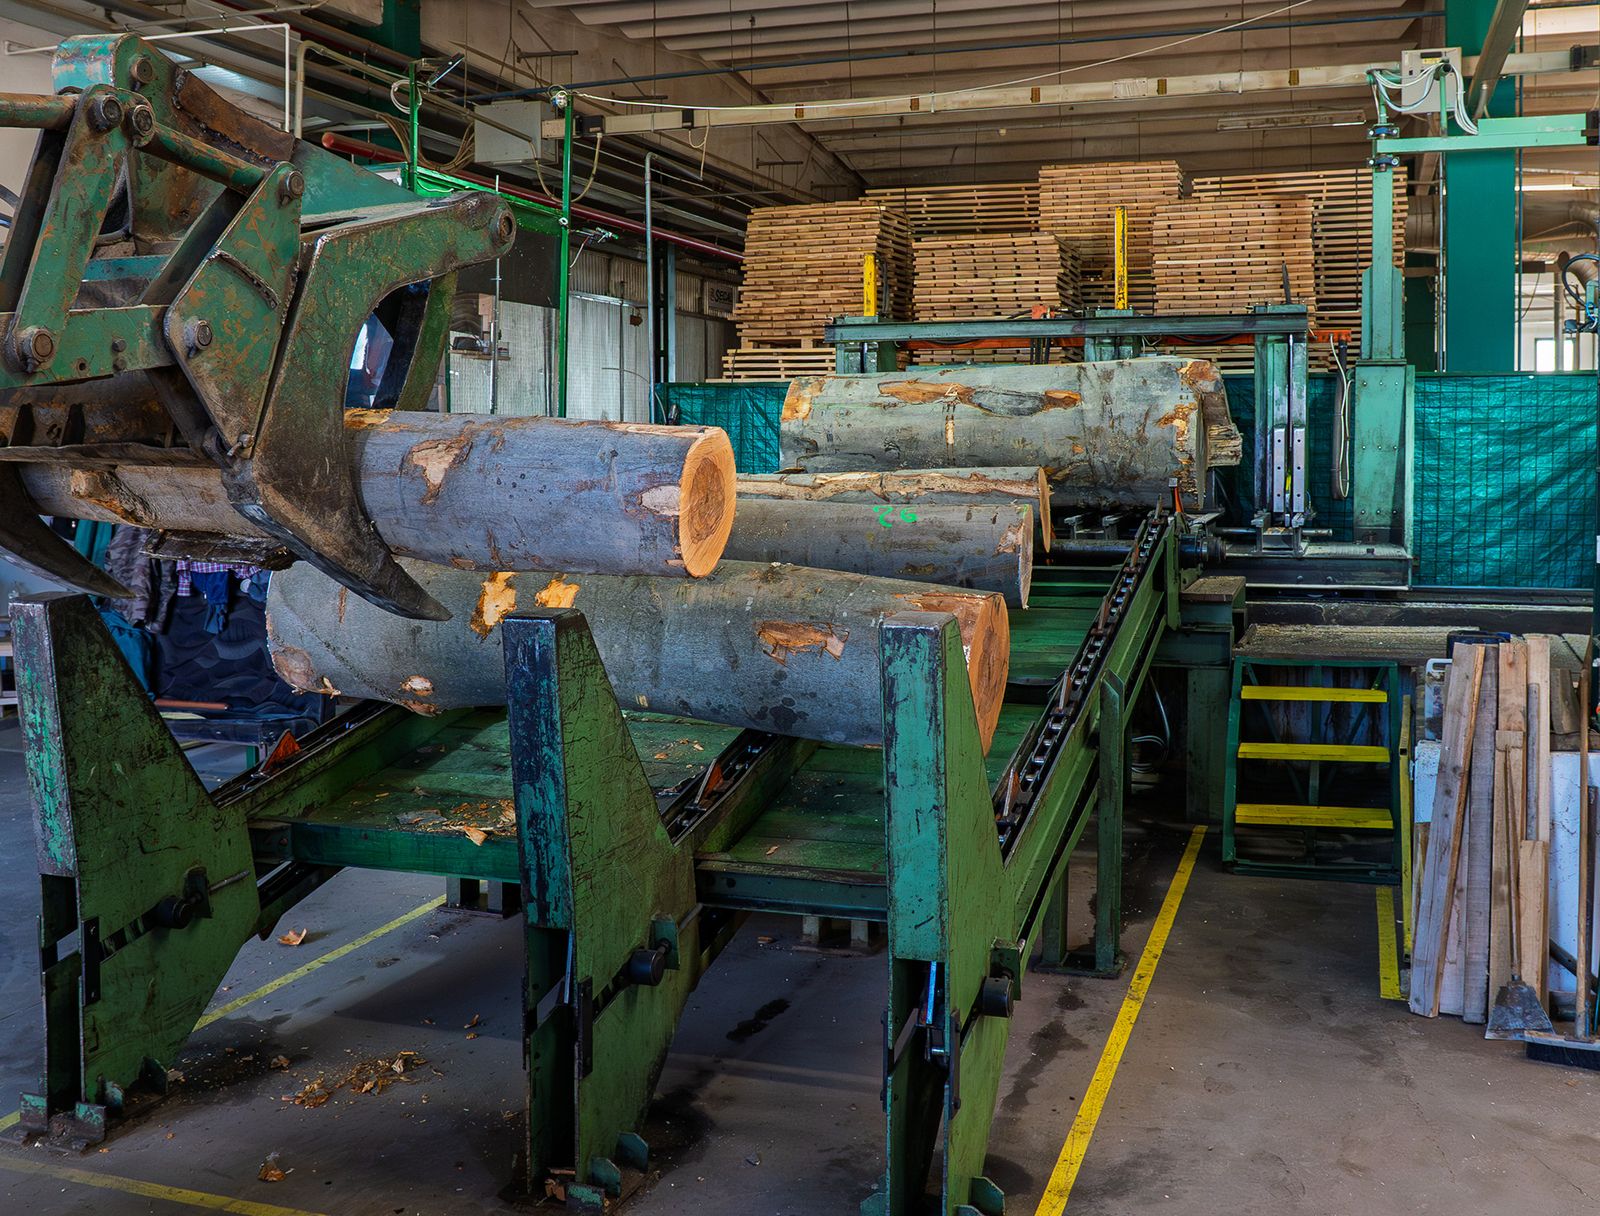
The FAO, ITTO and UNECE publish a worked example of where the volume goes when appearance-grade hardwood logs are sawn. Of 1 m³ of roundwood, about 0.14 m³ becomes sawdust in the saw kerf and 0.22 m³ leaves as slabs, trim, edgings and cull, leaving 0.64 m³ of rough green sawnwood. Expressed the other way round, the mill needs 1.57 m³ of logs for every cubic metre of green lumber.1
That is the sawmill's recovery, also called the lumber recovery factor: the volume of sawn lumber divided by the volume of logs. The FAO publishes it as a conversion factor, cubic metres of roundwood per cubic metre of sawnwood, which is simply the inverse.1 Log size and quality have a substantial impact on it: bigger, straighter logs give a higher share of boards and a smaller share of slabs.1
Why the measuring point changes the number
The same mill can report 64%, 57% or 44% recovery, depending on where it measures. The FAO example gives 64% for rough green sawnwood, 57% for rough dry and 44% for planed, finished sawnwood. Countries that tally sawnwood green, before drying, grade-trimming or planing, therefore report higher recovery than countries that tally the finished product.1 When you compare yield figures, the first question is always: measured where?
What European sawmills report
Countries that returned the FAO questionnaire report hardwood sawnwood at between 47% and 66% of log volume. The rest goes to chips and slabs, sawdust, shavings and shrinkage.1 Romania is not in the dataset.
Show the data
| Sawnwood | Chips and slabs | Sawdust and shavings | Shrinkage loss | |
|---|---|---|---|---|
| Slovakia | 66% | 17% | 9% | 8% |
| Poland | 63% | 18% | 17% | 2% |
| Ukraine | 61% | 24% | 10% | 5% |
| Germany | 60% | 16% | 20% | 4% |
| Spain | 53% | 27% | 14% | 6% |
| France | 47% | 36% | 14% | 3% |
Sawdust and shavings combined by us. Countries measure sawnwood at different stages (green, dry, planed), which explains much of the spread. Source: FAO, ITTO & UNECE (2020), Forest product conversion factors, fig. 4.4 (questionnaire 2018). Romania is not in the dataset.
The spread between countries reflects log size and quality, product mix and, again, the point of measurement, so it says little about who saws best. What it does show is the scale: in every country, at least a third of a hardwood log leaves the sawmill as something other than lumber.
Step 2: drying shrinkage and degrade
Drying removes water, and wood shrinks as it dries below the fibre saturation point. In the FAO example, kiln or yard drying takes the rough lumber from 0.64 m³ to 0.57 m³ per cubic metre of log, a loss of 0.07 m³ to shrinkage.1 The planing mill then removes another 0.13 m³ as shavings, sawdust and chips, leaving 0.44 m³ to ship.1
Shrinkage is unavoidable. Degrade is not. Surface checks, end splits, honeycombing, warp and stain all turn good lumber into shorter or lower-grade pieces, and they are mostly the result of drying too fast or too carelessly. Our articles on kiln drying and drying defects cover how they arise and how a kiln schedule prevents them.
Step 3: the rough mill, from lumber to parts
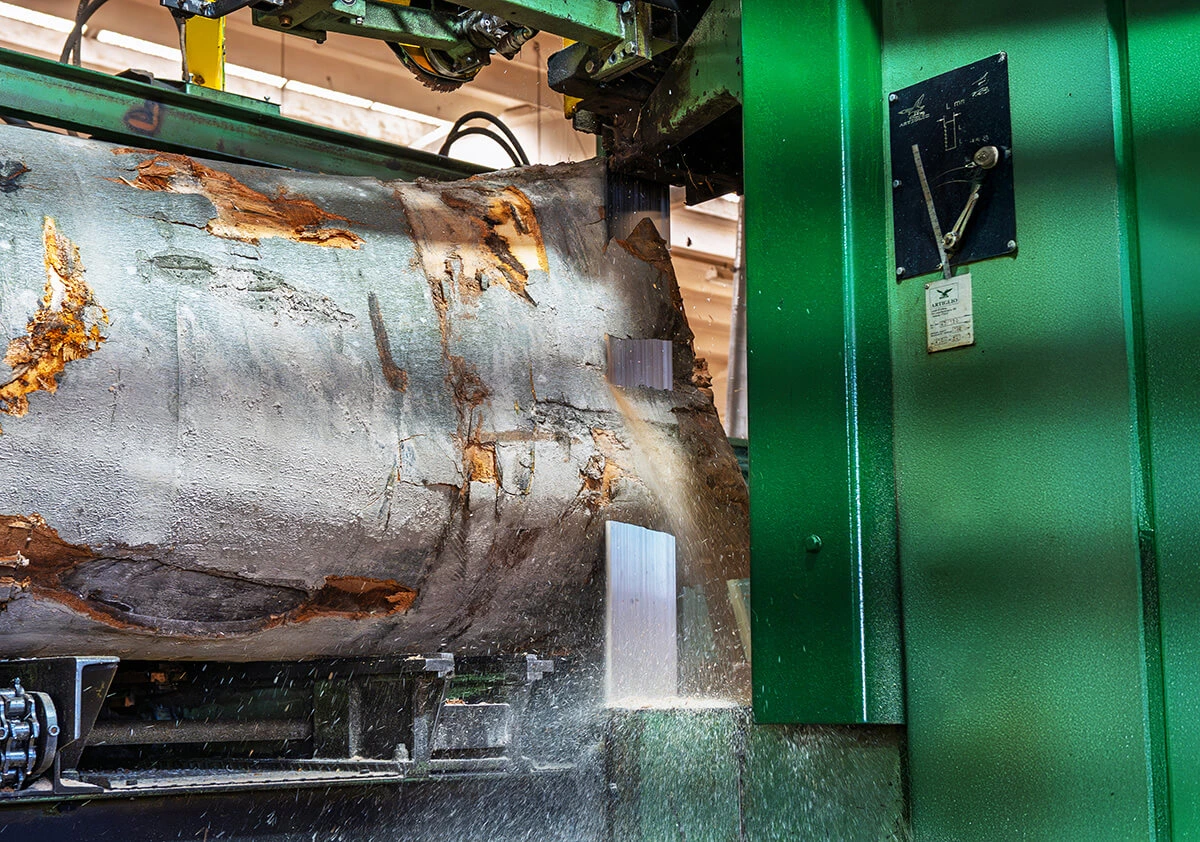
A furniture or component maker buys dried lumber and cuts it into rough dimension parts in a rough mill: boards are ripped into strips and cross-cut into lengths, removing defects on the way. This is where the second large loss happens, and where the operator has the most influence.
Grade matters: FAS, 1 Common and 2A Common
The USDA's rough-mill simulations on red oak show how strongly the lumber grade drives yield. Under the American NHLA grading rules, top-grade FAS lumber gave a primary yield of 81.1% on an easy cutting bill and 76.7% on a hard one. No. 1 Common gave 68.4% and 59.1%; No. 2A Common only 50.4% and 41.3%.2 A cutting bill is the list of part sizes and quantities to be cut; a "hard" bill asks for longer and wider parts.
Show the data
| Easy cutting bill | Hard cutting bill | |
|---|---|---|
| FAS | 81.1% | 76.7% |
| No. 1 Common | 68.4% | 59.1% |
| No. 2A Common | 50.4% | 41.3% |
A hard cutting bill asks for longer and wider parts. European EN 975-1 grades differ from NHLA grades. Source: Gatchell, Thomas & Walker (1999), Forest Products Journal 49(3), table 6, all-blades-movable arbor. American red oak.
Lower grades also cost more work. FAS needed about 1.1 cross-cuts per part, meaning most parts came out of long clear strips with one cut; 2A Common needed 1.6–1.7, meaning most parts had to be cut out individually between two defects.2 European grading under EN 975-1 uses different rules, and red oak is not European oak, so treat the numbers as an illustration of the grade effect, not as a beech or oak forecast. The lumber grading article compares the systems.
Rip-first or crosscut-first?
Rough mills follow one of two sequences. A crosscut-first mill chops boards to length, then rips the pieces to width. A rip-first mill rips the boards into strips, often on a gang ripsaw, then cross-cuts the strips. On lower grades, rip-first usually wins. In a benchmark run of the USDA's ROMI 4.0 simulator on a sample cutting bill, rip-first gave 67.4% yield from 545 boards, crosscut-first 52.8% from 663 boards: 27.7% more yield from the same lumber resource.3
Taking out the worst wood first
Rip-first mills gain further if poor sections are cut off before the gang ripsaw. In the USDA study, this preprocessing removed about 15% of 1 Common and about 30% of 2A Common input as salvage and waste, and the improved mix of boards and better segments raised net primary yield by 7.7% on the easy bill and 7.3% on the hard bill.2 The same study notes that about a quarter of more than 4,000 boards in 14 mills had 13 mm or more of crook, a curve along the edge, which ruins strips from a gang ripsaw unless it is cut out first.2
Optimising cross-cut saws and defect scanning: what the data say
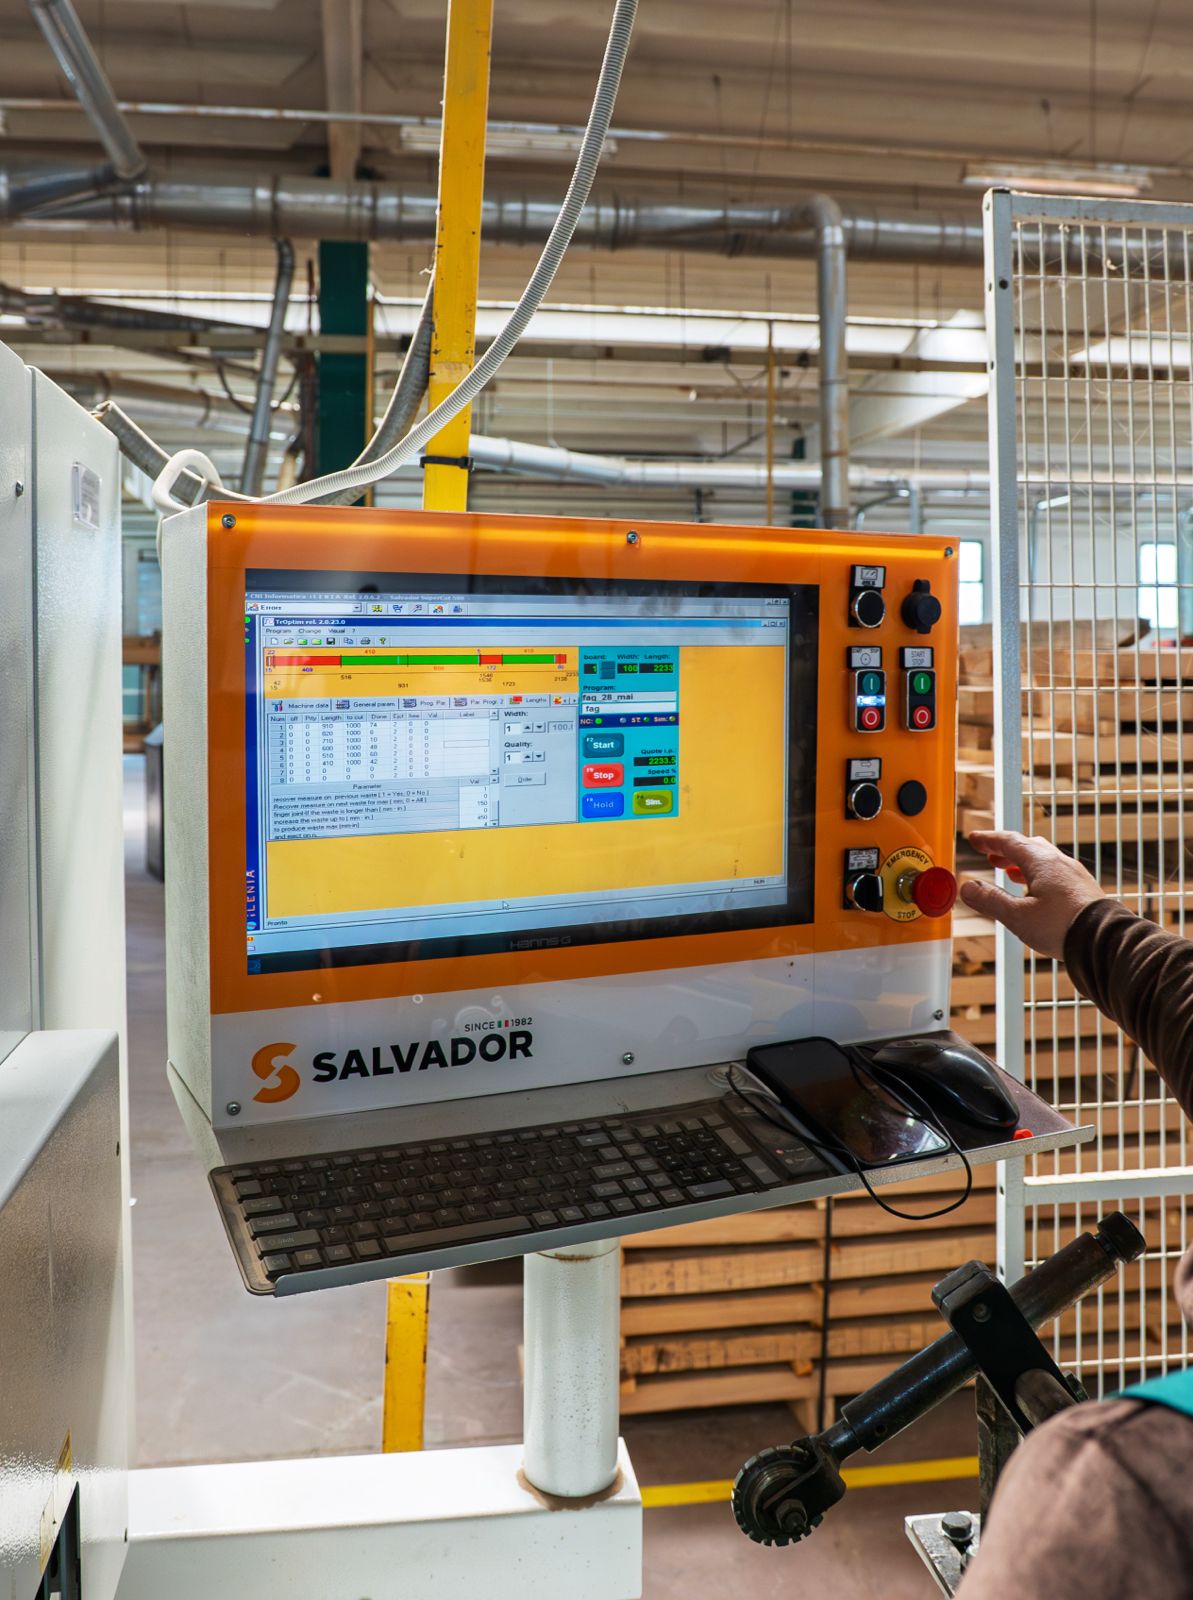
An optimising cross-cut saw (German Optimierungskappsäge) reads defect marks or scanner data along a board or strip, calculates the combination of part lengths that gives the most value from that piece, and cuts it automatically. Its job is to make the decision a skilled operator would make, every time, at line speed.
How much better than a person can it do? The cleanest evidence compares a real rough mill with a simulator optimising the same boards. On 158 kiln-dried red oak boards, mostly 1 Common, a rip-first mill achieved 64.0% yield producing clear parts; ROMI-RIP, optimising strips and cross-cuts together, reached 71.1% on the same boards, about 7 percentage points more. Over four scenarios, the simulated optimum averaged 4.8 points higher than the mill.4
Show the data
| Actual rough mill | Simulated optimum (ROMI-RIP) | |
|---|---|---|
| Clear parts only | 64.0% | 71.1% |
| Marks up to ~13 mm | 68.3% | 73.6% |
| Marks up to ~25 mm | 72.0% | 75.7% |
| Marks up to ~51 mm | 72.9% | 76.1% |
Mark sizes are diameters of sound character marks allowed in parts: 0.5, 1 and 2 inches, converted. Source: Thomas & Buehlmann (2003), Forest Products Journal 53(3), table 3. American red oak, mostly No. 1 Common.
Equipment makers publish their own gains for scanners and optimising saws. Those are vendor claims, usually measured on the vendor's terms, and we do not repeat them here. The research data suggest the realistic prize: several percentage points of yield on low and mixed grades, more on difficult cutting bills, less on clean FAS lumber where there is little left to optimise.
Accepting character marks: the cheapest yield there is
The chart above shows a second lever, and it costs nothing in equipment. When the same red oak boards were cut allowing small sound character marks in the parts, the mill's yield rose from 64.0% for clear parts to 68.3% with marks up to about 13 mm, 72.0% up to about 25 mm and 72.9% up to about 51 mm.4 A character mark is a natural feature that does not weaken the part, such as a small sound knot or mineral streak.
For a buyer that is an 8.9-point yield gain, about 14% more parts from the same lumber (our calculation), simply by writing the specification differently. Rustic and "lively" grades in furniture are not only a style; they are the most efficient way to use a log.
Finger jointing: turning short clear pieces into long parts
Every cutting bill has a shortest useful length. Clear pieces shorter than that become waste, even though they are perfectly good wood. Finger jointing turns them into continuous lengths, which then become lamellas for edge-glued panels, mouldings, frames and treads. That is why finger-jointed panels cost less than continuous-lamella ones: they are built from the part of the board that would otherwise be burned.
The trade-off is strength and appearance. A well-made finger joint can reach up to 90% of the tensile strength of clear wood, but measured beech joints reach about 64–72% of unjointed beech in tension.5,6 For panels, frames and mouldings that is ample; for long, highly loaded parts it may not be. The finger-jointing article sets out the data.
Beech blanks: how the sawing direction changes yield
Yield is also won or lost in how a board is cut into blanks. A Slovak study cut long beech blanks, 50 × 50 mm and 3 m long, from 50 mm beech boards in two ways. Sawing parallel to the board's axis, along the grain, gave 65.1–72.7% yield; sawing parallel to the board's edge gave 60.4–68.4%. The taper of the log decided which method was better: for blanks from logs tapering by 1.3 cm per metre or more, sawing along the axis gave both higher yield and less longitudinal warp.7
Beech is a European species here, which makes the study a useful counterpart to the American red oak data. It also shows that yield and quality go together: blanks sawn along the grain warp less after drying, so fewer of them are lost later.
Cutting bills and part sizes: where the buyer has the most influence
The simulations make one point repeatedly: the cutting bill drives yield as much as the lumber. The same red oak gave 81.1% against 76.7% on FAS, and 50.4% against 41.3% on 2A Common, depending only on whether the bill asked for short, narrow parts or long, wide ones.2 Long, wide parts need long, wide clear areas, which are rare in hardwood.
- Allow shorter parts or finger-jointed parts wherever the design permits. Short clear pieces are abundant; long ones are scarce.
- Combine part sizes on one order. A bill with many lengths lets the optimiser fill each board with something useful.
- Specify character marks where they do not affect strength or appearance, for example on hidden faces or painted parts.
- Agree on the grade by face. A part that needs one clear face, not four, yields far better.
By-products: sawdust, chips, offcuts and energy
None of the lost volume has to be wasted. In the FAO balance sheets, the non-lumber share of a hardwood log leaves the sawmill as chips and slabs, sawdust and shavings.1 Slabs and offcuts become firewood or chips; dry sawdust and shavings are the raw material for briquettes and pellets; mills with their own boilers burn residues to heat their kilns. Chips can also go to board mills.
The ranking matters. Wood kept in a product, a lamella, a chair leg, a panel, stays in use for decades. Wood burned for energy releases its carbon the same year. Every percentage point of yield recovered by optimisation or finger jointing is wood that stays in use rather than going to the boiler.
How we work at SARAL
What buyers can do to lower the cost per usable part
- Specify what the part needs, face by face. Clear on visible faces, sound character marks allowed elsewhere.
- Allow finger-jointed or edge-glued builds for parts where continuous wood adds cost but not function.
- Bundle part sizes so the optimiser can use more of each board.
- Accept a grade mix where it suits the design: lower grades cost less per cubic metre but yield fewer parts, so compare cost per part, not per cubic metre.
- Ask how yield is measured when a supplier quotes it: green, dry or planed; log to lumber or lumber to part.
- Ask about drying and conditioning, because degrade and stress in the lumber show up as rejects in the rough mill.
- Treat vendor yield claims as claims until they are shown on your own parts and lumber.
Frequently asked questions
What is a good lumber yield from a hardwood log?
In the FAO example for appearance hardwood, about 64% as rough green lumber, 57% after drying and 44% after planing. Reported national figures for hardwood range from 47% to 66%, depending on logs, products and where the volume is measured.1
How do you calculate the lumber recovery factor?
Divide the volume of lumber produced by the volume of logs sawn: 0.64 m³ of lumber from 1 m³ of logs is 64% recovery. The FAO conversion factor is the inverse, 1.57 m³ of logs per m³ of lumber. Always state whether the lumber was measured green, dry or planed.1
What is an optimising cross-cut saw?
A saw that reads marked or scanned defects along a board, calculates the most valuable combination of part lengths and cuts automatically. In research comparisons, optimised cutting beat a real rough mill by up to about 7 percentage points of yield.4
Why are finger-jointed parts cheaper than solid parts?
Because they are made from short clear pieces that would otherwise be waste, so more of each log becomes product. Rough-mill yields fall steeply when long, wide clear parts are required.2