Why sawmills are turning to scanners and AI
A sawmill decides much of the value of a log in the first few cuts. Turn the log a few degrees, open it a few centimetres higher, and the same knot ends up in the middle of a valuable board or in a slab. Until recently that decision was made from the outside: bark, shape, end faces and the sawyer's experience. On band saws for large logs, the sawyer has to decide within seconds where to set the next cut, based mainly on the log's surface and the faces already sawn.10
Scanning puts data behind that decision at three points in the chain: on the log deck, where scanners measure shape and, with X-rays, the inside; at the headrig, where an optimiser turns the log and chooses the cutting pattern; and on dried lumber, where camera and X-ray scanners grade boards and feed optimising cross-cut saws. "AI" here mostly means deep-learning models, usually convolutional neural networks, that have learned to recognise knots, cracks or rot from thousands of labelled images.1
This article sets out what the published evidence says for hardwoods, with one caveat throughout: most CT research is on softwoods, and most hardwood grading research is American. We say each time which species and which comparison a figure describes. Where volume is lost on the way from log to part, and how rip-first cutting and finger jointing win it back, is covered in our article on yield from log to furniture part.
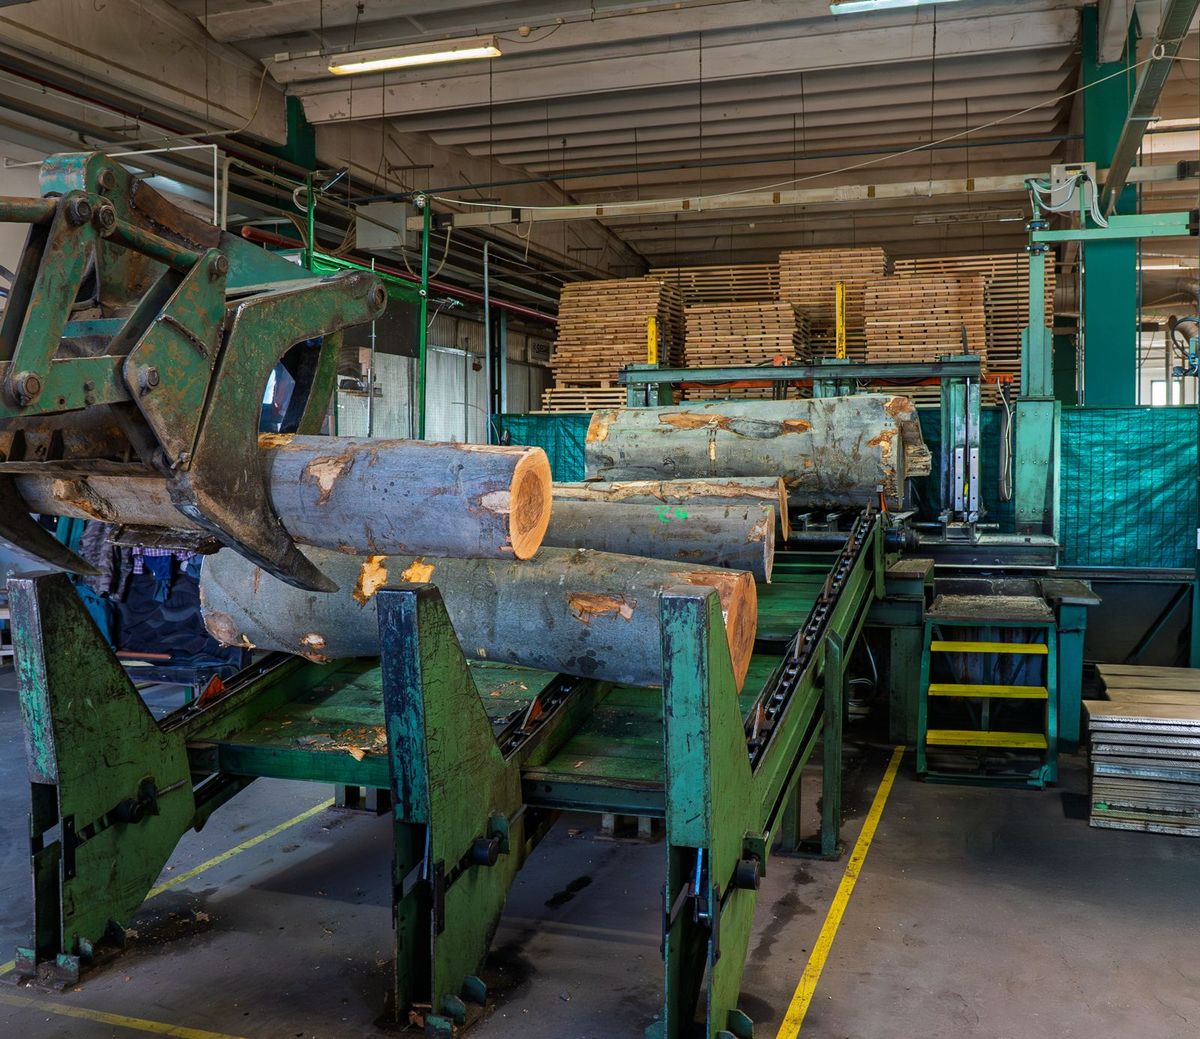
Three levels of log scanning: 3D, X-ray and CT
Not every "log scanner" sees the same thing. Optical and laser scanners measure the outer shape: diameter, taper, sweep, ovality and, at high resolution, bumps on the surface. Discrete X-ray scanners, used in leading sawmills since the 1990s, send X-rays through the log from one to four directions and estimate properties such as heartwood share, density, knot size, whorl spacing and ring width. Computed tomography (CT) goes further: it combines X-ray projections taken from all around the log into a full three-dimensional density map, slice by slice.6,2
Laser, camera and acoustic methods remain the workhorses. A 2022 Slovak study found them in all large automated sawmills in Europe and, increasingly, in medium-sized ones, while industrial CT scanners stayed rare because of their price.6
What a laser scan can tell about a hardwood log
Surface data alone say a lot about hardwood logs, whose grade depends heavily on surface defects. A US Forest Service system that analyses high-resolution 3D laser scans of logs with the bark on locates defects at least 13 mm high and 76 mm across. On 14 randomly selected logs it found 53 of 64 severe defects, wrongly flagged nine sound areas and located 90.2% of the defect area.11 That helps grade a log, but it is not a view inside: a knot overgrown for decades may leave only a faint trace on the bark.
How a CT log scanner works at sawmill speed
The industrial log CT used in the studies below is the CT Log, developed by the Italian scanner maker Microtec from 2008. Its designers describe a gantry with an X-ray source and a ring of sensors rotating at 240 rpm around a conveyor, reconstructing the log continuously as it passes. In the published specification it scans at 60–160 m/min, has a 90 cm field of view, takes logs up to 70 cm in diameter depending on wood density, and resolves 1 mm across the log and 10 mm along it.1
Speed is the hard part. A sawmill handles about ten logs a minute, far too many for anyone to read CT images by hand. In the published system a 6 m log is analysed in about 2.3 seconds by a cluster of computers, and the optimiser then tests about 10,000 virtual boards per log in one second to choose the most valuable cutting pattern. The whole chain fits between the scanner and a saw 16.1 m downstream.1
Knot detection in that system already uses AI: a convolutional neural network trained on more than 5,000 knots that experts had marked by hand in CT images. The developers also name a limit that applies to any species: in the outer sapwood, knots and sound wood have very similar density, so knots there are found mainly by texture and measured less precisely.1,3
The developers counted five working lines in early 2018, with a sixth about to start in Sweden. A Slovak study counted 14 worldwide in 2023, mostly in mills sawing conifers.1,2,7 One of them, at the National Forest Centre in Zvolen, was installed for research rather than production, which is why much of the recent European hardwood data comes from Slovakia.2
How much value does CT add? What the studies compared
Every published value gain answers a slightly different question. Some studies compare the best rotation of each log with a standard position, some with the average of all positions, and one with what the mill actually produced. Some assume perfect log-turning equipment; others add realistic errors. The table sets out the main studies.
| Study | Species and sample | Compared with | Value gain |
|---|---|---|---|
| Chang & Gazo 2009 (USA) | Red oak, white oak, black cherry, hard maple, yellow-poplar; 29 logs, medical CT | The mill's actual sawing of the same logs | +46% on average (red oak +24%, white oak +60%) |
| Stängle et al. 2015 (Germany, Finland) | European beech; 33 logs | Average of 12 rotation angles | Up to +24% (best angle) |
| Berglund et al. 2013 (Sweden), as reported by Rais et al. | Scots pine, Norway spruce | Conventional log position | About +13% on average |
| Rais et al. 2017 (Microtec) | Douglas fir; 36 logs, industrial CT at 120 m/min | Horns-up position, with turning and knot errors | +4%, +8% or +20%, by grade price spread |
| Belley et al. 2019 (Canada) | White spruce, jack pine; 53 trees | Conventional sweep-up sawing | +15% (spruce), +23% (pine) |
| Gejdoš et al. 2025 (Slovakia) | Pedunculate and sessile oak; 125 logs | Visual log grading (grading, not sawing) | Same class for 47% of logs; €30/m³ lower list value |
Baselines differ, so the gains are not directly comparable. Only the first two rows are hardwood sawing studies. Source: Chang & Gazo (2009); Stängle et al. (2015); Rais et al. (2017), who also report Berglund et al. (2013); Belley et al. (2019); Gejdoš et al. (2025). Full references below.
Three points stand out. First, the gains are mostly in value, not volume. Turning a log so that knots fall at the edges of boards, or into the boards headed for lower grades anyway, changes the grade mix far more than the cubic metres. The difference between volume yield and value yield is explained in our article on sawing patterns and quarter-sawn timber.
Second, the price spread between grades drives the result. In the industrial Douglas fir study, the same logs and the same CT data gave an average gain of 4%, 8% or 20%, depending only on how much more the top grades were worth.3 In hardwoods, where the best appearance grades sell at a multiple of the common grades, that cuts both ways: larger possible gains, and larger losses from a misjudged log.
Third, the hardwood evidence is thin, while softwood results are broader: a Canadian study of 53 white spruce and jack pine trees found 15% and 23% more lumber value from knot-optimised sawing than from conventional sawing.12 The European beech study used 33 logs and found that the best of 12 rotation angles gave up to 24% more volume and value than the average angle.4 The American study of five hardwood species used 29 logs scanned in a medical CT. Its 46% average gain compares an optimised simulation with the way the mill actually sawed the same logs, so part of the gain comes from optimisation itself, not only from the X-ray view. Gains rose from 27% on grade 1 logs to 97% on grade 3 logs.5
A scanner is only as good as the log turner
A CT optimiser can calculate the best angle to the degree, but the log turner has to deliver it. The Douglas fir simulation added a random turning error with a standard deviation of 5° and a realistic error in knot measurement, and still found the gains above. The same paper cites a Finnish estimate that turning errors must stay below about 2° standard deviation to avoid losing value, puts typical log rotators at about 4°, and reports a Swedish spruce study in which a 6° error cut the average gain from 11% to 6%.3 Better scanning pays only if the mechanics downstream keep up.
Oak and beech: why hardwoods are harder for CT
CT sees density, not colour. In spruce, a knot is clearly denser than the heartwood around it and stands out in the image. In oak and beech the contrast is weaker. A Slovak team that scanned oak, beech and spruce logs on an industrial CT found that the internal structure of the two hardwoods overlapped their defects, which appeared as connected areas of undefined shape rather than as separate features.6
A follow-up study sawed a 4 m beech log and part of an oak log into 20 mm slices and compared every defect with the CT image. Location was accurate on both, within 0.90% on beech and 1.21% on oak. Size was less reliable: on beech the CT dimensions differed by 3.5% on average, but on oak they were clearly overestimated, a bark pocket by more than three times. The scanner also missed a false heartwood zone in the beech log and one knot in the oak. The authors conclude that the technology was developed mainly for conifers and that its software is not yet tuned to some hardwoods.2
Two practical limits matter for large hardwood logs. The same team saw ring-shaped image artefacts on logs thicker than about 650 mm, and their 2025 study notes that image noise increases above 750 mm diameter, although defects remained identifiable.2,7 Large oak and beech butt logs fall right in that range.
CT grading of 125 oak logs
The most useful hardwood study for buyers is a 2025 Slovak comparison of 125 pedunculate and sessile oak logs, bought for high-value uses such as barrel staves. Each log was graded twice under the Slovak hardwood log standard: by eye, as in normal forestry practice, and from CT images and 3D models.7
The two methods agreed on 47.2% of the logs. CT placed 42.4% in a lower class and 10.4% in a higher one. The authors' breakdown of the deciding features: for 60% of the logs, the features were visible to the eye but measured differently on the CT images; overgrown knots decided the grade of 16.8% of the logs, heart shakes 10.4% and sweep in more than one direction 9.6%. At Slovak list prices for the second quarter of 2024, the average value fell from €157.32 to €127.16 per cubic metre.7
That drop is not a loss caused by CT. It is value the visual grade had overstated. For a sawmill buying logs, learning this before sawing is the whole point; for a forest owner selling them, it is less welcome. The broader lesson is that log grades under EN 1316-1 and its national versions are only as reliable as the measurement behind them, a point our guide to hardwood lumber grading also makes for sawn timber.
AI defect detection on boards: what accuracy figures mean
Most AI in hardwood processing today works on boards rather than logs: in grading lines at the end of the sawmill, and in the scanners that feed optimising cross-cut saws and rip saws. These systems combine colour cameras, lasers that read the surface profile, and sometimes X-rays, with software that classifies each defect and then applies a grading rule or a cutting bill.8
"Accuracy" can mean three different things: whether a defect was found, whether it was correctly classified, or whether the final grade or cut was right. Papers report all three, so figures are comparable only within one study.
Grading lines: machines against human graders
The benchmark is not perfection but the human grader. In 2003 a Virginia Tech multi-sensor prototype graded 89 red oak boards correctly 63% of the time, against 48% for the production-line graders. It estimated lumber value within 6% of a certified NHLA inspector, while the line graders overvalued it by close to 20%.13 Fifteen years later, a commercial scanner with colour cameras, lasers and an X-ray sensor graded more than 9,000 rough, kiln-dried boards of nine American hardwoods in a Midwestern sawmill. It reached 92.22% on-grade and 99.50% on-value accuracy, against minimums of 80% and 96% in the NHLA sales code. The authors cite studies that put human inspectors at 48–75%.8
One detail matters for oak buyers: white oak needed an adjusted grading solution because of iron stain, which the scanner would otherwise have read as a defect.8
Optimising cross-cut saws and lamella sorting
European data are thinner but closer to component work. A Croatian study compared the deep-learning software of an industrial colour scanner with software developed in a research project, on 40 oak lamellae from door production. Neither was better across the board. The industrial scanner found sapwood every time but the broad rays of quarter-sawn oak, its silver figure, only 27% of the time; the project software found the rays in 82% of cases but recognised ambrosia beetle marks in only one case in five. Averaged over all six defect types, the two detected about 60% and 62%.14
A 2025 study trained a Mask R-CNN network on 2,972 images of beech lamellae for edge-glued panels and sorted them into three appearance classes plus cracked pieces with 90.90% overall accuracy.15 A Purdue team showed that a neural network can tell 11 commercial hardwoods apart from board images with 98.2% accuracy, which would let a scanner switch its settings when the species changes instead of waiting for an operator.16
None of these figures is a guarantee for a particular line. Accuracy depends on species, lighting, surface, defect definitions and the number of labelled examples the model has seen. For a buyer, the figure that matters is the reject rate in their own parts.
What scanning costs, and which mills can justify it
Published prices for log CT are rare. A 2023 Slovak paper puts the investment in the order of millions of euros and says this has made it profitable only for large mills.2 The economics have looked similar for decades. A 1990 US study of CT for hardwood sawmills assumed an investment of US$1.5 million, the upper end of what fast medical scanners then cost, plus about $175,000 a year for service. At a 15% required return, the scanner paid in a large mill with a value gain of only 8.5%; a small mill needed more than 30%.17
Mill sizes are 25, 10 and 5 million board feet a year, converted at 2.36 m³ per thousand board feet (our conversion). A 2019 Austrian simulation of a mid-sized European softwood mill, cutting about 100,000 m³ a year of spruce and larch and focusing on its band saw for large logs, calculated an internal rate of return of 5% to 42% over ten years, depending on how far CT was assumed to shift output towards higher-value products. The authors note that successful industrial applications were still rare and that real data on CT gains in band-saw mills were lacking.10
Board scanners cost less. In 2002, vision-based lumber scanners were priced under US$1 million, and the authors of a US rough-mill study estimated that a system halving rejected parts would pay back in under a year in an average American rough mill.18
Vendors publish their own figures. Microtec's hardwood page says CT Log may raise sawmill revenue by 15–20%, and its case study of a North American mill sawing alder, ash and maple quotes the operator as sawing "within stated paybacks" after four months, without disclosing the numbers.19,20 These are claims, not independent measurements. For smaller operations the Slovak researchers suggest a different route: renting capacity on an existing CT line, for example to certify valuable logs before an auction or for high-value products such as barrels and musical instruments.2,7
What small and medium mills can do without CT
The same research shows where the cheaper gains are, because the human steps around the saw are often the weakest link.
Mark defects more accurately
Many rough mills still mark defects by hand with fluorescent crayon, and an optimising cross-cut saw then cuts to the marks. A US rough-mill study judged an experienced operator against strict criteria: 78% of the marks deviated from the ideal position. 43% of defects were missed, 33% were marked inside the defect and 2% of marks flagged sound wood. Yield before rejects was 63.5%; after removing parts with unwanted defects it was 47.4%, with 22% of parts rejected. An earlier test of six experienced rough-mill employees had scored them at 68% on average.18
Show the data
| Marking accuracy | Usable yield |
|---|---|
| Normal marking errors | 39.1% |
| 25% fewer errors | 44.4% |
| 50% fewer errors | 45.7% |
Yield as part area out over board area in. Measured in a US rip-first rough mill and simulated. Source: Buehlmann & Thomas (2003), Impact of board-marker accuracy on lumber yield, FAIM 2003. Grade mix from Buehlmann & Thomas (2002).
A follow-up simulation put a value on training: with 25% fewer marking errors, usable yield rose from 39.1% to 44.4%; with 50% fewer, to 45.7%.9 The authors recommend marking a few millimetres into the clear wood beyond each defect, better lighting and clearer, written defect specifications.18
Grade and measure logs carefully
In the oak study, most differences came from features that were visible but hard to measure in the yard: sweep judged with the log lying on an uneven support, overgrown knots that show only faintly on the bark, and surfaces dirty with dust and mud or wet from rain.7 Cleaning log ends, measuring sweep on a level support and recording each log's grade against what it actually yields cost little, and build the data any later scanner would need.
Turn the log deliberately
The beech CT study found up to 24% difference in value between the best and the average rotation angle.4 Without a view inside, a sawyer can still use what the surface shows, and laser scanning of hardwood logs finds most severe surface defects automatically.11 Turning each log so that visible defects end up in the edgings, or in as few boards as possible, is the manual version of what a CT optimiser does.
How we optimise at SARAL
What to ask your supplier about scanning and optimisation
- How are defects found before the optimising saw? By operator marks, by a camera scanner, or both. Each has its own error pattern.
- Which defects are cut out, and with what margin? Ask for the written defect rules: knot size, cracks, sapwood, stain, ray figure, and whether the marks or scanner settings leave a safety margin into clear wood.
- Which grading rule does an automated grade follow? EN 975-1, NHLA or a house rule. A machine applies a rule consistently, but only the rule it was given.
- How are colour features handled? Sapwood, red heart in beech, iron stain in oak and ray figure are colour or texture features. CT, which reads density, may not see them; cameras do, with varying success.
- Is the scanner set up for your species and surface? Published tests needed species-specific calibration, and rough boards are harder to read than planed ones.
- What are the yield and reject rates on parts like yours? Ask for figures on your own cutting list, not a brochure average.
- Treat vendor figures as claims until they are shown on your own timber.
Frequently asked questions
What is a CT log scanner?
A computed tomography scanner built for sawmills. It X-rays each log from all sides as it passes on a conveyor and reconstructs the inside in 3D at up to 160 m/min, so an optimiser can choose the rotation and cutting pattern before the first cut.1
How much does CT scanning increase sawmill value yield?
In published simulations, typically 4–24% in value against a standard log position or the average position, depending on species, the price gap between grades and the accuracy of the log turner. Hardwood studies are few and use small samples.3,4,5
Can AI detect wood defects better than people?
For grading, published tests say yes: a commercial scanner reached 92.22% on-grade on nine American hardwoods, against 48–75% reported for human graders. Detection of individual defect types varies widely, from under 30% to 100% for different features in one oak study.8,14
Is a CT scanner worth it for a small sawmill?
Rarely on its own. A US analysis found small hardwood mills would need value gains of more than 30% for a CT scanner to pay, against 8.5% for large mills. Renting scanning capacity, better defect marking and careful log grading are cheaper first steps.17,2,9