What nearshoring means for furniture buyers
Nearshoring means moving production closer to the market it serves. For a furniture brand or retailer in Germany, Austria or Switzerland, that usually means shifting part of the sourcing from Asia to Central and Eastern Europe. The case for it rests on a few measurable things: production capacity, labour costs, productivity, distance and transit time, raw material, and compliance. Each can be checked against official data.
This article does that for Romania, using Eurostat statistics wherever they exist. It does not try to prove that Romania is the cheapest or the best location. In several respects it is not, and the numbers below show where. It is meant to help buyers who are weighing a Romanian supplier against Polish, Baltic or Asian ones to ask the right questions.
Europe's furniture map: who makes what
Eurostat's structural business statistics measure furniture manufacturing (NACE class C31) country by country. In 2024 the EU produced furniture worth about €110 billion and employed about 900,000 people in it; both totals are Eurostat estimates.1 Production is concentrated: Italy and Germany together account for almost half of the value, and Poland is a clear third.
Romania produced furniture worth €2.6 billion in 2024, about the same as Lithuania and Portugal. The sector employed 51,014 people, down from 53,889 a year earlier, in 6,391 enterprises.1 The average Romanian furniture enterprise has eight people, the same as in Poland and Italy and below Germany's fourteen.1 Most suppliers a buyer meets are therefore small or medium-sized companies, which matters for capacity planning.
Romania's furniture exports in numbers
Comext, Eurostat's trade database, shows what leaves the country. In 2025 Romania exported wooden furniture, wooden seats and their wooden parts worth €1.19 billion. About 78% went to other EU countries. The largest single markets were Germany (€198 million), France (€164 million), Italy (€115 million) and the Netherlands (€100 million); outside the EU, the United States (€68 million) and the United Kingdom (€56 million) led.6 Seats and seat parts made up €425 million, or 36% of the total. That is a higher share than in Poland (34%) or Italy (26%) (shares are our calculation from the same data).6,7
The trend is flat. Romania's exports of finished wooden furniture and seats (without parts) were €935 million in 2015, peaked at €1.25 billion in 2022 and stood at €1.03 billion in 2025, in nominal euros. Over the same period Poland's grew from €4.1 billion to €7.2 billion and Lithuania's from €0.9 billion to €1.7 billion.6 Romania has kept its position as a furniture exporter; it has not been the region's growth story.
Where Germany buys its wooden furniture
For a DACH buyer, German import data show where the competition already is. In 2025 Germany imported finished wooden furniture and wooden seats worth €5.88 billion, up from €4.67 billion in 2019. Poland alone supplied €2.45 billion, about 42%. China followed with €519 million. Romania supplied €154 million, about 2.6%, less than Lithuania (€189 million) and roughly level with Türkiye, Czechia, Slovakia and Hungary.2
Two shifts stand out between 2019 and 2025. Imports from Türkiye more than doubled, from €62 million to €149 million, and imports from Ukraine rose from €57 million to €121 million. Imports from Vietnam and Indonesia fell.2 Romania's share has barely moved. For a buyer, that means Romanian suppliers with spare capacity for the German market exist, but the established nearshoring channel is Poland.
Labour costs: what Eurostat actually shows
Across the economy
Eurostat's labour cost levels cover wages plus employers' social contributions and taxes, per hour worked. In 2025 the hourly labour cost in industry, construction and services was €13.6 in Romania and €12.0 in Bulgaria, the two lowest in the EU, against an EU average of €34.9 and €45.0 in Germany. In manufacturing alone, Romania was at €12.0, Bulgaria at €10.2, Poland at €17.1 and Germany at €49.5.8
The gap is narrowing. Romania's manufacturing labour cost rose from €10.8 to €12.0 an hour between 2024 and 2025, about 11%; the EU average rose from €33.8 to €35.0, about 4% (our calculation from the Eurostat levels).8
In furniture manufacturing
The structural business statistics give a sector-specific figure: employee benefits expense per hour worked by employees. In furniture manufacturing in 2024 it was €6.92 in Bulgaria, €7.20 in Romania, €8.83 in Hungary, €11.66 in Poland, €25.87 in Italy, €34.87 in Germany and €35.97 in Austria. The EU average is estimated at €20.77.1 Among the member states with published data, Romania is second lowest, not lowest.
Show the data
| Employee cost per hour | Value added per hour | |
|---|---|---|
| Bulgaria | 6.92 € | 9.92 € |
| Romania | 7.20 € | 9.45 € |
| Hungary | 8.83 € | 12.90 € |
| Portugal | 11.19 € | 15.65 € |
| Poland | 11.66 € | 17.80 € |
| Lithuania | 13.17 € | 21.51 € |
| Czechia | 13.96 € | 20.95 € |
| Slovakia | 14.33 € | 15.45 € |
| EU-27 | 20.77 € | 30.00 € |
| Spain | 20.79 € | 30.50 € |
| Italy | 25.87 € | 43.34 € |
| France | 29.80 € | 37.19 € |
| Germany | 34.87 € | 48.60 € |
| Austria | 35.97 € | 46.42 € |
EU-27 and France are Eurostat estimates. Employee cost covers wages, salaries and employers' social contributions. Source: Eurostat, structural business statistics sbs_ovw_act, indicators EXPN_SAL_BEN_HW_EUR and AV_HW_EUR, NACE C31, 2024 (updated 30 September 2026).
Productivity: why the gap is smaller than it looks
Labour cost per hour is only half the picture. The same Eurostat dataset shows the value added per hour worked: €9.45 in Romanian furniture manufacturing in 2024, the lowest in the chart, against €17.80 in Poland, €43.34 in Italy and €48.60 in Germany.1 Value added per hour reflects automation, product mix and prices as well as how hard people work, so a low figure does not mean poor workmanship. It does mean that each hour produces less value on average.
Eurostat combines the two in its wage-adjusted labour productivity: value added per person employed divided by average personnel costs. For Romanian furniture makers it was 126% in 2024, against an EU average of 127%, 130% in Germany and 134% in Poland.1 In other words, for every euro spent on staff, a Romanian furniture maker generates about as much value added as the EU average. The advantage of a Romanian supplier therefore depends on the specific factory: its machinery, its product focus and how much of the work is automated.
Distance and transit times by road
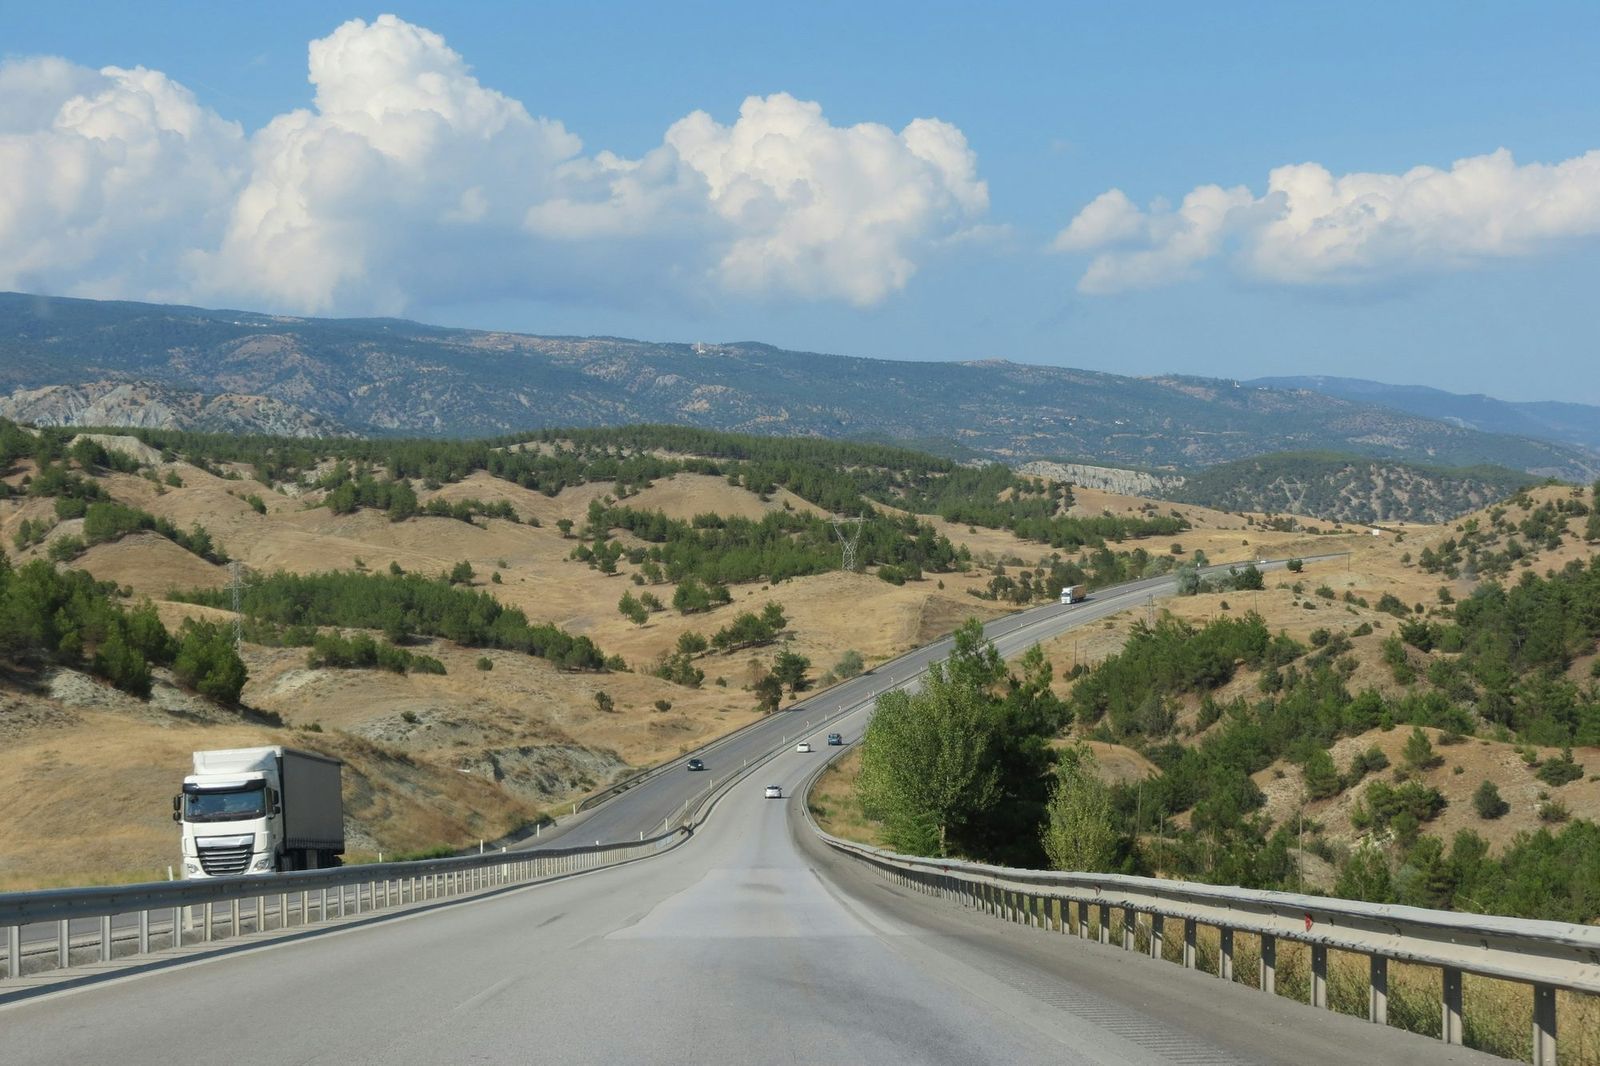
From Romania, the practical route to Central and Western Europe is by road. Road distances from Bălțați, in Iași county in the north-east of the country, range from about 1,160 km to Vienna to 1,570 km to Munich and 1,790 km to Stuttgart, calculated on OpenStreetMap data.3
EU rules set the floor for transit times. A driver may drive at most 9 hours a day, extended to 10 hours no more than twice a week, with a 45-minute break after 4.5 hours of driving and no more than 56 hours a week.4 Heavy trucks must have a speed limiter set at 90 km/h.9 Dividing the distance by 90 km/h therefore gives the minimum driving time, before breaks, rest periods, loading, traffic and mountain roads.
| Destination | Road distance | Minimum driving time | Minimum driving days, one driver |
|---|---|---|---|
| Vienna | 1,162 km | 12.9 h | 2 |
| Munich | 1,572 km | 17.5 h | 2 |
| Hamburg | 1,697 km | 18.9 h | 2 (one 10-hour day) |
| Frankfurt am Main | 1,766 km | 19.6 h | 2 (two 10-hour days) |
| Stuttgart | 1,792 km | 19.9 h | 2 (two 10-hour days) |
| Milan | 1,874 km | 20.8 h | 3 |
| Cologne | 1,876 km | 20.8 h | 3 |
| Zurich | 1,895 km | 21.1 h | 3 |
| Lyon | 2,310 km | 25.7 h | 3 |
Floors, not schedules: they exclude breaks, daily rest, loading, traffic and slower roads. Source: Distances: OSRM routing on OpenStreetMap data, fastest route to the city centre, calculated 24 October 2026. Driving rules: Regulation (EC) No 561/2006, Articles 6–7; limiter: Directive 92/6/EEC as amended by Directive 2002/85/EC. Driving time and days are our calculation.
In practice, delivery times depend on whether the load is a full truck or groupage, on the route and on the forwarder; the table shows the physical floor, not a schedule. Since 1 January 2025 there have been no checks on persons at the internal land borders with and between Romania and Bulgaria, including the Romanian–Hungarian border that westbound trucks cross.10
Romania vs Asia: sea freight, the Red Sea and stock
How long the sea leg takes
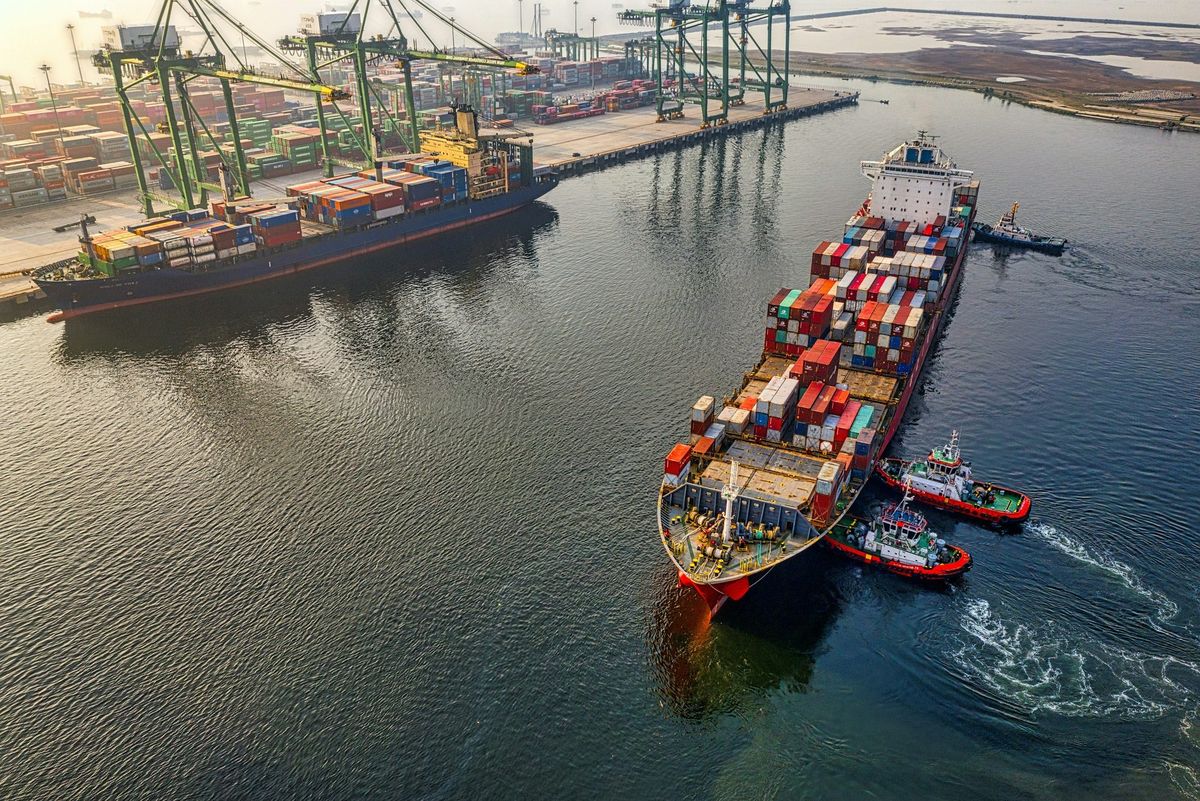
A container service from Shanghai to Rotterdam through the Suez Canal covers about 10,600 nautical miles, about 27 days at 16 knots without port calls. Around the Cape of Good Hope the distance is about 13,800 nautical miles, about 35 days. A typical Asia–Europe service with five to ten port calls takes about 35 days even on the Suez route.5 Add inland transport at both ends, customs and port handling, and goods are weeks in transit.
The Red Sea situation as of October 2026
After months in which most Asia–Europe container services sailed around the Cape of Good Hope to avoid the Red Sea, the shipping lines were returning as of mid-October 2026. According to Alphaliner, 63% of Far East–Europe capacity, 5.5 million of 8.7 million TEU, was deployed on services using the Red Sea between 15 September and 15 October 2026. Evergreen and ZIM were the only two of the ten largest carriers that had not returned.11 Routing can change again, which is itself part of the nearshoring argument.
What a shorter supply line changes
- Capital tied up in transit. Goods paid for at shipment spend five weeks at sea instead of a few days on the road.
- Order size. A truck can be filled with a mixed load of several items, while sea freight favours full containers. Smaller, more frequent orders are easier from a nearby supplier.
- Development speed. A prototype or a corrected sample can be on a buyer's desk in days, and a visit to the factory takes a day's travel.
- Reaction to demand. Re-orders of a best-seller arrive within the season.
None of this is free: a nearby supplier with higher costs per piece can still be the more expensive option for long runs of standard products. The comparison has to be made per product, including freight, duties, stock and the cost of slow corrections.
The wood behind the furniture
Romania has its own hardwood. The latest national forest inventory (IFN cycle III, 2020–2025) measures 7.05 million hectares of forest, about 30% of the country; beech covers 35.8% of it and oaks 18.1%.12 For solid wood furniture this means beech and oak can be sawn, dried and machined within the same region, sometimes within the same factory. Our article on Romania's hardwood forests in numbers explains the inventory figures, harvest data and the traceability system.
EUDR: compliance as part of the nearshoring case
For most companies, the EU Deforestation Regulation (EUDR) applies to wood and wooden furniture placed on the EU market from 30 December 2026.13 Romania, like every EU member state, is classed as low risk, which allows simplified due diligence but still requires geolocation of the harvest plots and a due diligence statement.14 A supply chain that runs from a Romanian forest to a Romanian sawmill and factory is short and easy to document compared with one that crosses several continents. Our guide to the EUDR for timber and furniture explains who files what.
What nearshoring to Romania does not solve
- Rising costs. Labour costs are rising faster than the EU average, as shown above. Price agreements should say how long they hold.8
- Currency. Romania uses the leu, not the euro. Most export contracts are priced in euros, but the supplier's costs are partly in lei.
- Capacity. With eight people per enterprise on average, many suppliers cannot absorb a large order overnight.1 Ask about capacity per week, not only about price.
- Uneven standards. Quality systems, documentation and English or German language skills vary between suppliers. Audit before you order.
- Distance still matters. North-east Romania is two to three driving days from southern Germany, not one.
How we work with buyers at SARAL
Checklist: evaluating a Romanian furniture partner
- Capacity in your product. Weekly output for parts like yours, not total factory size.
- Raw material. Own sawmill and kilns, or bought-in timber and panels; species and grades available.
- Machinery and process. Which steps are automated (optimising, finger jointing, CNC, finishing) and which are manual.
- Documentation. EUDR origin data, formaldehyde compliance, test reports for seating, and how they are delivered.
- Logistics. Full truck or groupage, typical transit time to your warehouse, packaging and Incoterms.
- Price terms. Currency, validity, and whether prices are tied to timber or labour indices.
- A sample and a visit. A first-article sample made on production machines, and a day in the factory.
Our guide to choosing a hardwood components supplier turns these points into a full request for quotation.
Frequently asked questions
Is Romania cheaper than Poland for furniture production?
Per hour, yes: furniture makers spent €7.20 per hour worked in Romania and €11.66 in Poland in 2024. But value added per hour was also lower (€9.45 against €17.80), so the cost per unit of output differs much less. Eurostat's wage-adjusted productivity was 126% in Romania and 134% in Poland.1
Which EU country has the lowest labour costs in furniture manufacturing?
Bulgaria, at €6.92 per hour worked in 2024, followed by Romania at €7.20 and Hungary at €8.83, among the member states with published data.1
How long does a truck take from Romania to Germany?
From north-east Romania, Munich is about 1,570 km and Stuttgart about 1,790 km by road. Under EU driving-time rules and the 90 km/h limiter, one driver needs at least two days of driving, before loading, breaks and traffic.3,4,9
Which countries produce the most furniture in the EU?
Italy (€27.3 billion of output in 2024), Germany (€23.4 billion) and Poland (€13.9 billion), followed by Spain and France.1
Is Romania in the Schengen area?
Yes. Checks on persons at internal land borders with and between Romania and Bulgaria were lifted on 1 January 2025.10